Ten years after the Supreme Court’s ruling in Obergefell v. Hodges legalized same-sex marriage nationwide, a Pew Research Center survey finds that two-thirds of LGBTQ adults say the decision made the country more accepting of same-sex couples.
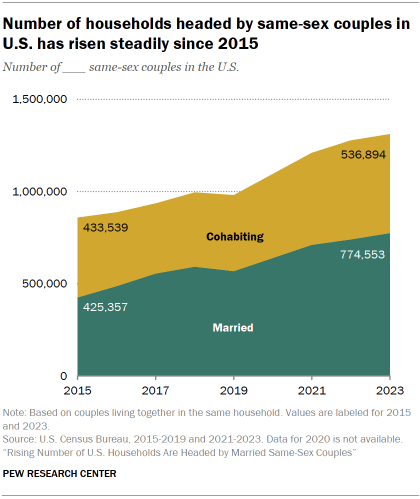
Since 2015, the number of households headed by same-sex married couples in the United States has risen steadily from 425,357 to 774,553 in 2023, according to U.S. Census Bureau data.1
The number of households headed by same-sex cohabiting couples has also risen over this period. It started at 433,539 in 2015 and increased to 536,894 by 2023.
Despite these increases, same-sex married couples represent a very small share of all married couples – just 1.3% in 2023. Same-sex cohabiting couples account for 5.6% of all cohabiting couples. (Read a demographic profile of same-sex couples below.)
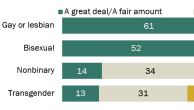
Our accompanying survey finds that while love and companionship are top reasons for same-sex couples to get married, a majority of adults with a same-sex spouse also say legal rights and benefits are a major reason.
In general, men and women in same-sex couples express a great deal of satisfaction with their relationship. Those who are married tend to be more satisfied with certain aspects than those who are living with a partner. (Read more from our survey about how same-sex couples describe their relationships.)
These findings come from a Pew Research Center survey and analysis of government data. The survey data is based on the responses of 1,154 adults who are married to or living with a same-sex spouse or partner as part of a larger, nationally representative survey of LGBTQ U.S. adults conducted Jan. 8-19, 2025. The analysis of government data about same-sex and different-sex couples is based on data from the U.S. Census Bureau and American Community Survey.
Related: The Experiences of LGBTQ Americans Today
A demographic profile of same-sex couples
The demographic characteristics of same-sex married couples vary somewhat from those of different-sex (sometimes referred to as opposite-sex) married couples. The patterns are largely similar when comparing same-sex and different-sex cohabiting couples.
Learn more: Detailed tables on cohabiting couples
Where do same-sex married couples live?
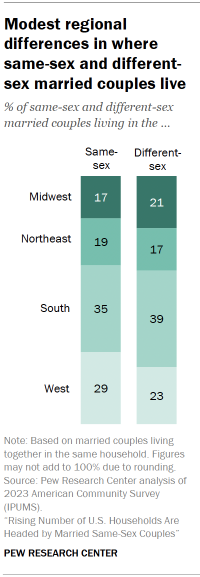
While substantial shares of same-sex married couples live in all four regions of the United States, there are some differences in where they live compared with different-sex couples.
- Same-sex couples are more likely than different-sex couples to live in the West (29%, compared with 23% of different-sex couples) and the Northeast (19% vs. 17%).
- Different-sex couples are more likely than same-sex couples to live in the South (39% vs. 35%) and the Midwest (21% vs. 17%).
Economic characteristics
The rest of this analysis looks separately at same-sex couples with two women and those with two men because the findings often vary between these two groups.
Education
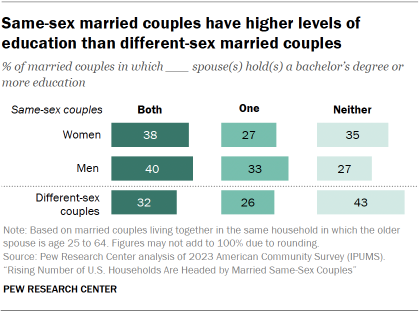
Same-sex married couples have higher levels of education than different-sex married couples. This is especially true of couples where both spouses are men. (This analysis focuses on couples who have mostly completed their education – those in which the older spouse is age 25 to 64.)
- Both spouses have a bachelor’s degree: This is the case in 40% of same-sex married couples with two men and 38% of same-sex couples with two women. The share is smaller for different-sex married couples (32%).
- One spouse has a bachelor’s degree: This is the case in 33% of same-sex married couples with two men and smaller shares of same-sex couples with two women (27%) and different-sex couples (26%).
- Neither spouse has a bachelor’s degree: 43% of different-sex couples fall into this category, compared with smaller shares among same-sex couples with two women (35%) and those with two men (27%).
Employment
Same-sex and different-sex married couples also have different work arrangements. (This and the remaining analyses focus on working-age couples – those in which the older spouse is age 18 to 64.)
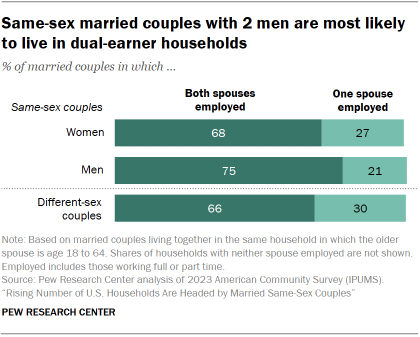
Three-quarters of same-sex married couples with two men have both spouses employed full- or part-time. The shares for same-sex married couples with two women and different-sex couples are smaller (68% and 66%, respectively).
Work arrangements vary somewhat depending on whether couples have minor children in their home. But even among married couples without children, those with two men are the most likely to have both partners working (75%). And among married couples without children, those with two women (69%) are more likely than different-sex couples (64%) to have both spouses employed.
Income
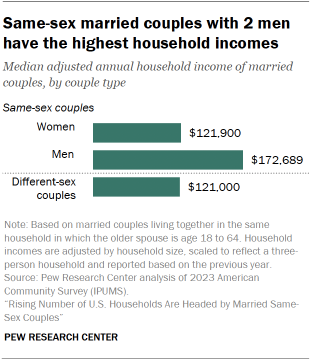
Differences in education and employment may contribute to differences in married couples’ household incomes. Same-sex married couples with two men have the highest household incomes – $172,689 at the median. Incomes for other married couples are:
- $121,900 among same-sex couples with two women
- $121,000 among different-sex couples
Family characteristics
Raising children
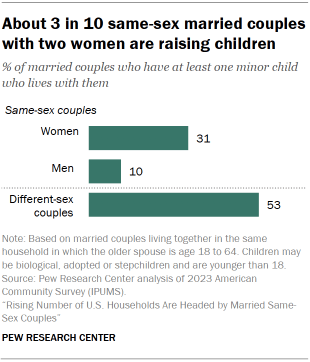
Among different-sex married couples, just over half (53%) are raising children (defined here as having at least one child younger than 18 who lives with them). The shares are lower for same-sex couples and vary widely by gender.
- 31% among same-sex married couples with two women
- 10% among same-sex couples with two men
Remarriage
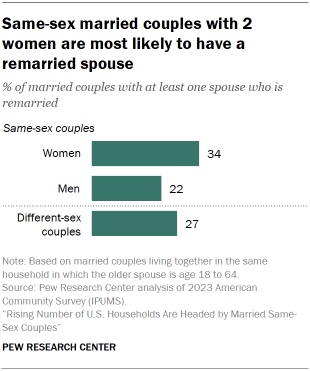
Roughly a third (34%) of same-sex married couples with two women include at least one spouse who is remarried. The shares are lower for other married couples.
- 27% among different-sex married couples
- 22% among same-sex married couples with two men
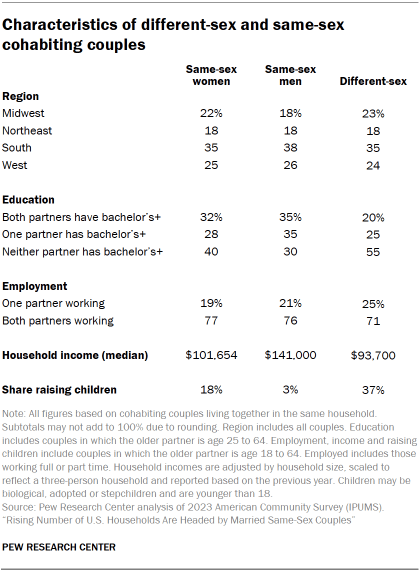
Key characteristics for same-sex and different-sex cohabiting couples
The table below compares key characteristics of same-sex and different-sex couples who are living with an unmarried partner. For example, the section on region shows that 23% of different-sex cohabiting couples live in the Midwest, as do 22% of same-sex cohabiting couples with two women and 18% of same-sex cohabiting couples with two men.
How same-sex couples describe their relationships
Our survey of LGBTQ adults in the U.S. found that most who are married to or living with a same-sex spouse or partner (92%) say their relationship is going at least fairly well, including 63% who say it is going very well. Relatively few (8%) say it’s not going too well or not going well at all.
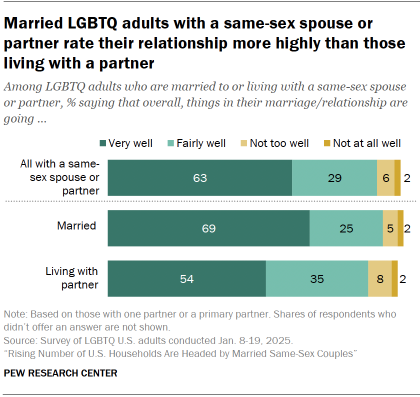
Those who are married are more likely than those who are living with their partner but not married to say things are going very well (69% vs. 54%).
A 2019 Pew Research Center survey of married or cohabiting U.S. adults found a similar pattern. Among adults with a different-sex partner, those who were married were more likely than those who were cohabiting to say things were going very well in their relationship (58% vs. 42%).
In that survey, 55% of married or cohabiting adults with a different-sex partner said things were going very well in their relationship. That’s 8 percentage points lower than the share who said this in this year’s survey of LGBTQ adults with a same-sex spouse or partner.
Satisfaction with various parts of the relationship
Majorities of adults with a same-sex spouse or partner say they’re at least somewhat satisfied with several aspects of their relationship and home life. But as was the case among adults with different-sex partners in 2019, fewer than half are very satisfied with:
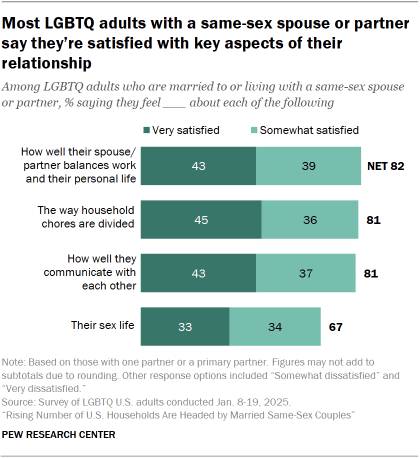
- The way household chores are divided (45%)
- How well they and their spouse or partner communicate with each other (43%)
- How well their spouse or partner balances work and their personal life (43%)
- Their sex life (33%)
Men and women with same-sex partners are equally satisfied with these aspects of their relationship.
For the most part, those who are married are more likely than those who are living with a partner to say they are very satisfied with various aspects of their relationship. There is no difference between married and cohabiting couples saying they are very satisfied with their sex life.
Reasons for getting married
Perhaps not surprisingly, large shares of married LGBTQ adults with a same-sex spouse say love, companionship and wanting to make a formal commitment were major reasons they got married.
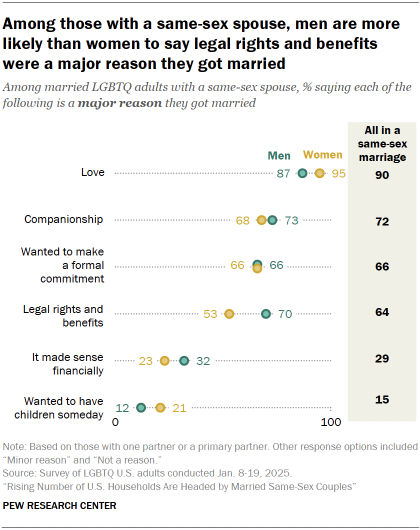
But most (64%) also say legal rights and benefits were a major factor in their decision.
Smaller shares say it made sense financially (29%) or they wanted to have children someday (15%).
There are significant differences by gender and age when it comes to legal rights and benefits and wanting to have children.
Differences by gender
Among those with a same-sex spouse, men are more likely than women to say legal rights and benefits are a major reason they got married (70% vs. 53%).
Women are more likely than men to say wanting to have children someday is a major reason they got married (21% vs. 12%).
Differences by age
About three-quarters of those ages 50 and older (74%) say legal rights and benefits are a major reason they got married. Smaller shares of those under 50 (53%) say the same.
In turn, those younger than 50 are much more likely than those 50 and older to say a major reason is they wanted to have children someday (26% vs. 5%).
Reasons for moving in together
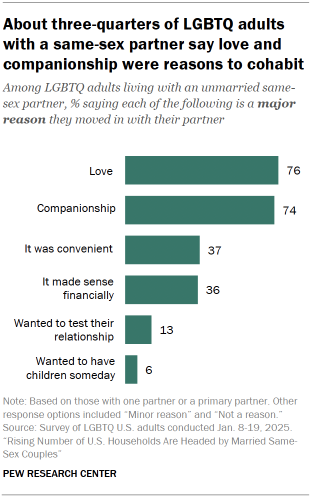
Love (76%) and companionship (74%) are also the top reasons adults living with a same-sex partner give for deciding to move in together.
Smaller shares say each of these is a major reason:
- It was convenient (37%)
- It made sense financially (36%)
- They wanted to test their relationship (13%)
- They wanted to have children someday (6%)
How same-sex couples split up household tasks
We also asked some questions to understand how same-sex couples divide certain household chores and who does more to support the household financially.
We find no clear-cut division of labor when it comes to cooking, cleaning, fixing things or financial contributions.
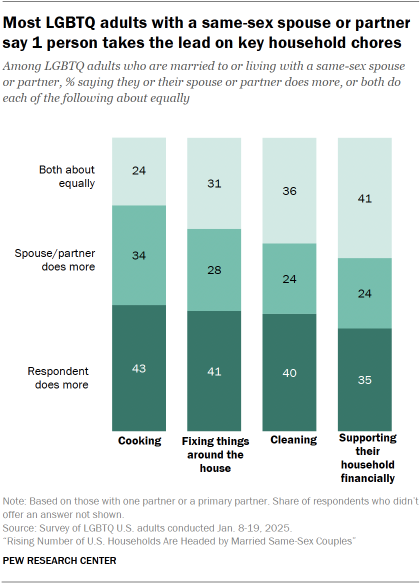
On each of these items, respondents are more likely to say they do more than their spouse or partner than to say their spouse or partner does more. Still, there is no item for which majorities say one does more than the other.
These responses don’t differ much by gender of the couple or whether they’re married or living together but not married.
When we’ve asked men and women in different-sex couples how they divide up household chores, we also find pluralities saying they are shared equally. However, perceptions of who does more differ widely by gender.